Ramachandran Plot
A Ramachandran plot,[1] in which the phi and psi dihedral angles for each residue are plotted against each other. By doing this for a large number of proteins, Ramachandran found that certain combinations of dihedral angles are conformationally favoured. Other regions of the Ramachandran plot are only sparsely populated, due to the steric interactions preventing those particular combinations from occurring.
The favoured regions correspond to the major secondary structure elements in a protein. For example, in the figure below region A corresponds to the α -helix, region B to the β -sheet and region C to the comparatively rare left-handed α -helix.
Most amino acids will stay within these regions, with the notable exceptions being glycine and proline. Since glycine has only a hydrogen side chain, it has much more conformational freedom than other residues, and as such can adopt phi-psi angle combinations not available to other residues. Proline, on the other hand, being a secondary amine, is much more conformationally restricted than other amino acids, which is why it has a tendency to break secondary structure, with the exception of the polyproline helices.
Ramachandran’s original plot modelled the atoms of the amino acids as hard spheres defined by their van der Waals radii. For this plot, the allowed and favoured regions were restricted only to conformations where the electron clouds did not overlap.
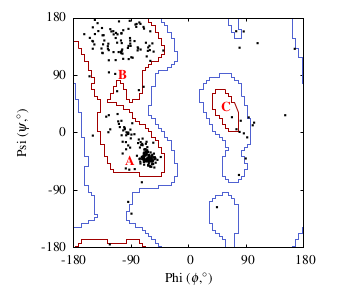
Ramachandran plot for a variant of the Enoyl-Acyl Carrier Protein Reductase in Mycobacterium Tuberculosis (PDB code: 1zid) after minimization. Favoured regions (red) and allowed regions (blue) taken from Richardson et al. 2003.[2] 3 A= α -helix region; B= β -sheet region; C=left handed helix region.
Planted: Wednesday, 22 February 2023
Last tended: Monday, 23 June 2025
G. N. Ramachandran, C. Ramakrishnan, and V. Sasisekharan. Stereochemistry of polypeptide chain configurations. J. Mol. Biol., 7:95–99, 1963. ↩︎
S. C. Lovell, I. W. Davis, W. B. Adrendall, P. I. W. de Bakker, J. M. Word, M. G. Prisant, J. S. Richardson, and D. C. Richardson. Structure validation by C Alpha geometry: Phi, Psi and C Beta deviation. Proteins, 50:437–450, 2003. ↩︎