An Introduction to Network Graphs
The Königsberg bridge problem, or more importantly Euler’s approach to solving it, is widely considered to be the birth of graph theory. The city of Königsberg sat on a river which divided the city into four separate landmasses linked by seven bridges. The question underlying the problem is whether or not there is a path through the city which crosses each of the bridges exactly once. Euler simplified the problem by representing each of the andmasses of Königsberg as points and each of the bridges as lines joining each point. This abstract representation of the city was the first example of the kind of graph that graph theory is concerned with.
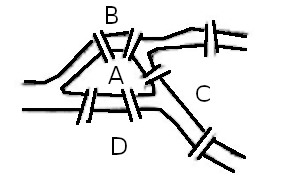
Diagram of the four landmasses of Königsberg showing the seven bridges connecting them
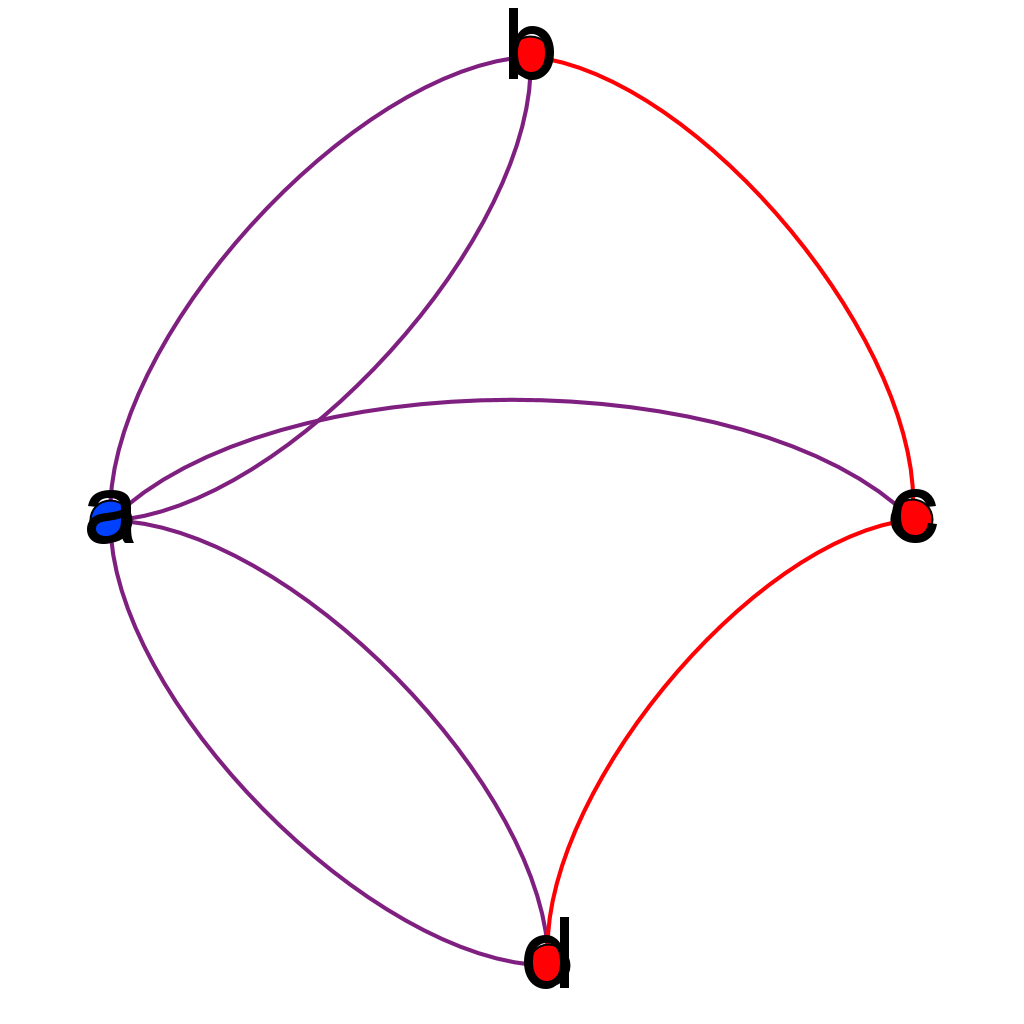
the problem represented as a graph, with the nodes being the landmasses and the edges being the bridges.
Many different problems can be represented using graphs, which can help simplify the problem or otherwise provide a different point of view of the problem. Graph theory then is a tool with which to approach the solving of a specific problem. One important thing to note is that the language describing graph theory is not unified or standardised and thus different authors and groups will use their own terminology; the terms “graph”, “network model”, “network” and “network graph” are often used interchangeably.
A graph is a representation of a set of points and of how they are joined up.[1] It can be used to model the pairwise relationships between objects, or for other applications. The points on the graph (often referred to as nodes or vertices) can represent more or less anything: people, places or peptides. The lines between the points (or edges) represent the relationship between the nodes. For example the nodes in a particular graph
could be people and the edges represent whether or not the pair are friends on Facebook; or the nodes could be cities around the world and the edges represent flight travelling between two cities. The graph displays the relationship between the nodes and and any metrical properties (such as the distance between the cities) are not included.
A simple graph is one in which each two nodes have a maximum of one edge connecting them; there are no nodes with multiple edges between them nor any nodes with a loop connecting it to itself.
A weighted graph,[2] which is sometimes referred to as a network,[3] is one in which the edges connecting two nodes are assigned a value, or weight which measures the strength of the relationship between the nodes. The nature of the edge weight will be dependant on the problem being investigated.
An undirected graph is one in which there is no distinction between the nodes associated with each edge, while in a directed graph the nodes are joined by edges that go in a specific direction, from one node to the other. In this thesis all network models are undirected.
Various algorithms exist for organising such graphs or models, and the resulting model can be used to visualise complex, often dynamic, data in a more intuitive manner than the raw data. The layout of a particular graph can have a critical effect on the graphs ability to convey information. Depending on the problem being investigated it might be useful to find out how specific sets of nodes cluster together, or have no edges; in other cases the layout may need to be done manually in order to maximise the usefulness of the graph.
Planted: Friday, 24 February 2023
Last tended: Monday, 23 June 2025